L.A. Times launches sharable electoral vote map

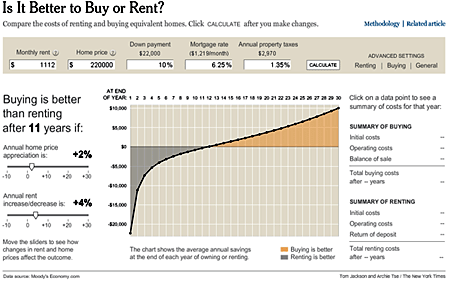
Which campaign will get to 270 in November, and how will they do it? The L.A. Times has built an interactive map that allows readers to create and test their own electoral vote scenarios, and then embed those scenarios in their own sites.

Sample electoral vote scenario: (not my prediction; just an uneducated guess for demonstration purposes only)

This is the creation of Sean Connelley, our Flash guru, based on our 2004 electoral vote tracker. The cool addition this time around is the sharing functionality.

We’re hoping to improve on this as the campaign heats up, perhaps adding demographic info and data on past elections by state. Would love to hear suggestions.

Newspaper websites shine with online campaign graphics

Every election cycle inspires innovation at newspaper websites. This year, leading U.S. newspapers are offering some stunning online graphic tools to help their readers get an overview of the many elements of the campaign, at a glance.

One appropriate place to begin in following the 2008 presidential election campaign is to survey the existing balance of power between the nation’s top two political parties. Congressional Quarterly’s Election Map, on CQPolitics.com gives readers the option to see the publication’s projected Democrat vs. Republican breakdown for U.S. House and Senate seats, as well as for governors and the state-by-state results for the 2004 Presidential election. Clicking on each district launches a new browser window detailing demographic information about the district, and its recent election history.

The marquee race in 2008 is, obviously, the campaign to replace George W. Bush as U.S. President. The New York Times offers separate pages laying out the Democratic and Republican primary schedules, but the Los Angeles Times offers a superior Primary Tracker that combines all the information in the NY Times’ graphics, but in one easy-to-navigate page.

LAT graphic

The LA Times’ graphic includes both a timeline of primary schedules for both parties, as well as a U.S. map that accesses state-by-state details. Instead of placing bullet points for each state’s primary election on the appropriate date of the timeline, the LA Times weighs the data points, placing larger circle in place of points for the primaries in larger states. That allows readers to understand the impact of shared primary dates like February’s “Super Tuesday” at a quick glance, instantly rewarding the reader for his or her attention to the graphic and, I suspect, enticing many of them to click around and discover what other information lies within.

Contrast the LA Times’ thoughtful effort with Politico’s Follow the Campaign Trail, which serves up a cartoon of a U.S. map, and nothing else to engage the reader on first glance. Click on each state, and you’re served a list of “coming events” that include many already months past. Silliness does not trump substance, in this case.

My only quibble with the LA Times’ effort is that one must click on the various states to see information about their upcoming elections in the detail box, instead of merely mousing over the state. But otherwise, the LA Times’ feature provides a powerful example of how an online graphic can pack more information into a smaller space than can a print graphic, while assisting, rather than impairing, reader comprehension.

The NY Times shines, however, with its compelling page tracking Presidential campaign finances. The initial page underwhelms, but click on a candidate’s name, and one finds a rich geographic overview of the candidate’s financial support. Look toward the bottom of the page, and you’ll find a timeline that illustrates how that candidate’s contributions have fluctuated over the campaign’s course.

NYT graphic

Another nice touch: Click to see the details on one candidate, then select another, and you do not return to the overview, but instead go to the detail page for that other candidate. That makes navigating through candidate-by-candidate comparisons a breeze.

Finally, to see where each candidate will be each day of the campaign, click to the Washington Post’s outstanding Campaign Tracker. The Post’s page blends a custom Google Map with a traditional list of candidate appearances. Click a candidate’s name, and you will find a weekly schedule, with mapped to another Google Map, as well as an analysis of where the candidate is spending the most time… and raising the most money.

The Best of the SND.ies

Judging online journalism awards always is a great opportunity to see the best work newsrooms are doing. But as those of us who have been competition judges know, we usually view entries in only a couple categories – best sports section, best online commentary, etc. We don’t get to see the full range of work that has been submitted.

That’s why judging the final round of the SND.ies awards, the Society for News Design’s Best of Multimedia Design Competition, can be an educational experience. This year, nine judges gathered in late August at the University of North Carolina-Chapel Hill for an intense two days of reviewing, discussing, and evaluating a wide variety of entries. Something unique about the SND.ies is the lack of a requirement that the judges designate a gold, silver or bronze winner in each category. There may, in fact, be no entries that make it to gold status, or silver, or any award level. It makes the discussion of each entry focused much more on its individual merits rather than comparing it with others in the category.

As a judge (Nora Paul) and the competition coordinator (Laura Ruel) we observed some distinct trends in multimedia design. Without revealing the winners (they will be announced on Oct. 13 at the SND awards banquet in Boston) we’d like to discuss the types of entries that we saw, the elevation in the quality of entries during the past few years, and the kinds of usability questions that this next level of multimedia seem to raise.

Five types of entries

First of all, we want to say how impressed we are with the variety of ways journalists are using multimedia forms to tell stories. This year, we observed five distinct types of entries:

  • Animated infographics
  • Infotoys
  • Narratives
  • You are there
  • BOPs (Big Ole Packages!)

    Animated infographics

    These entries are informational graphics that explain a sequence of events in an accident, or the steps in a process or show how something works. This type of presentation style has become more sophisticated and clean since the competition began in 2002. The influence of elmundo.es’ high quality work in this area is clear. Most of these entries have a simple, streamlined look, with an appropriate use of white space. They are basic line drawings that reveal complex working parts, and – in some cases – provide a linear explanation of a sequence of events.

    One of this year’s finalists, NYTimes.com’s recreation of Cory Lidle’s airplane crash into a New York apartment building, shows the power of animation to detail the sequence of events.

    It is educational to see how the initial, static graphic evolved into the animated infographic produced a few days later, after all the details of the ill-fated flight were available.


    Initial, static graphic for print publication.

    Animated storytelling graphic

    Infotoys

    We like to call this “data you can play with.” Although we have seen this form in years past, this year’s entries seem to be pushing this storytelling method a bit further.

    Take a look at this package by indystar.com. It is an excellent use of a controlled, interactive graphic that lets users explore statistical information.


    Indystar.com used statistical data to provide an historical overview of the Colts.

    Another good example of customizable data came in the form of a NYTimes.com piece, “Is it Better to Buy or Rent?” This interactive helps consumers evaluate data in a changing market. It is extremely useful. The flexibility of the interface and the factors considered when providing advice about buying versus renting is sophisticated and easy to use. Moreover this presentation has a great shelf life. It can benefit readers for years to come.


    This NYTimes.com interactive is an excellent example of being able to customize the content output based on your personal settings.

    “Infotoys” with crime data also made their way into the pool of entries. While this isn’t a new concept, inquirer.philly.com’s display does more than just take the data and marry it with a map. It takes it to another level by providing a simple interface that allows users to customize views. It also provides contextual information about the number of homicides.


    Philadelphia Homicides in 2006 goes beyond the traditional crime data map.

    Multimedia narratives

    We’re categorizing these pieces as self-contained packages that follow a single – somewhat linear – narrative thread. This year we saw an excellent uses of images and increasingly well produced and well synced audio overlays. We believe the use of Soundslides, a production tool for still image and audio Web presentations, has helped journalists to focus more on the content and less on the technology. Consequently, they are moving multimedia narratives to a new, more advanced level.

    One example is Palmbeachpost.com’s simple, elegant, touching narrative about train jumping. It is well focused, simple and has great news value. Offering the presentation in both Spanish and English adds to its appeal.


    Train Jumping by palmbeachpost.com is an impressive, touching multimedia narrative.

    You are there

    High level graphics and embedded POV/panoramic images are being used to create “you are there” packages that give users a sense of location and exploration. These allow the users the control to customize their viewing experiences.

    Elpais.es used beautiful 3D illustrations with just enough animation to let the user get a close-up look at Formula 1 racing.


    Formula 1 racing comes to life with this elpais.com presentation.

    In “The Met’s New Greek and Roman Galleries” by NYTimes.com, 3-D renderings and panoramas place viewers inside a new area of the museum. It is a strong interactive that gives the user a large amount of control with clean 3-D work, smooth, easy-to-use panoramas and elegant design.


    NYTimes.com: The Met’s New Greek and Roman Galleries

    BOPs: Big Ole Packages

    BOPs are large compilations of storytelling materials such as the text, videos, audio slide shows, animated graphics and interactive applications. These ambitious packages tell complex stories with many layers of information. Two special challenges for producers of these pieces include:

  • Organization: Designers of the most successful of these story packages resisted the temptation to organize these pieces by media form. The winning entries didn’t use menu items such as “video,” “photos,” etc., but rather used descriptive story labels that summarized the story areas by topic.
  • Interface: With so much information, the most successful of these packages had navigation that helped spark user interest in the story. Navigation also was intuitive enough to allow people to easily and effortlessly find their way into all the material – and just easily find a way out.

    One example of a BOP is a St. Pete Times’ piece about Florida’s wetlands. In most cases it uses the best media forms to tell particular parts of the story. For example, an interactive graphic clearly explains how wetlands work. To add depth to the text stories, the designers use highlighted links to primary source documents that aid in revealing politicians’ true leanings. The videos, graphics and photos each complement each other without duplicating content.


    This St. Pete Times’ Web presentation about an ecological crisis uses multiple forms of media to tell the story.

    Another BOP example is a class project by students from UNC-Chapel Hill, Universidad de los Andes and Universidad del Desarrollo that documents life in the Atacama Desert, Chile – the driest place on earth. The animated graphics, informative audio, powerful images and carefully chosen video combine to provide a great example of integrated multimedia storytelling.


    Atacama Stories is a large-scale student project that combines storytelling methods to provide an in-depth look at this desert environment.

    The challenge

    It is clear from this competiton that the skills in multimedia use have become more sophisticated in some newsrooms and the styles that seem to be most effective are getting copied and re-used to very good effect. While this competition is about recognizing great work, the real winners are the news audience.