Online usability questions that need answers

If your home page has a rotating menu of featured stories at the top, do users look at it, understand how it works and use it to navigate the site? How about a slideshow with text, sound and images: Do users attend to all three of these items at once? How about the number of links or other informational items on a home page: What number is ideal? When do we cross the line between being informative and becoming overwhelming?

If you’ve ever wondered about these questions, you are not alone. Some of the sharpest minds in online journalism gathered at the University of Minnesota’s Institute for New Media Studies about a month ago to discuss some of their pressing research questions and to set the research agenda for DiSEL: The Digital Storytelling Effects Lab.


Tyson Evans, LasVegasSun.com, discusses the value of research

The group is part of DiSEL’s first official consortium. Eleven news organizations made financial and time commitments to help Laura Ruel and Nora Paul (authors of this column) determine what to test with eyetracking, usability, and effects research methods.

It was no surprise to anyone that there were many more questions than we could answer in the first round of research. We had to prioritize. In this column we’ll let you know what’s on the horizon. We also invite you to add your thoughts to the mix by completing the DiSEL survey.

Riding a carousel; wearing a belt

No, it wasn’t a circus (well maybe!) or a fashion show. The terms “carousel” and “belt” were the focus of some big design questions. Carousels, the group determined, are the pieces at the top of a home page that rotate images and/or headlines to promote stories. Martha Stewart’s site, http://marthastewart.com, was one that the group referenced as having an interesting form for its “carousel.”

Graphic
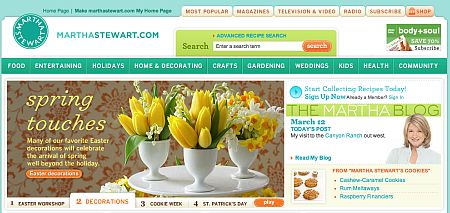
Martha Stewart’s site directs users to content with a carousel.

In this case the carousel can be rotated in an autoplay mode (user clicks the “play” button) or manually (user clicks the section name).

“Carousels are coming up a lot,” said Jaime Hutt from startribune.com. “Are there standards?”

Others also wanted to know what works with this form.

Chris Snider from desmoinesregister.com was curious if it is more effective to use a carousel or have a user scroll a panel of story images to navigate to content that is not on the home page.

“What works in carousels and what doesn’t?” he asked.

Similar to carousels are belts. These navigational items usually appear mid-page or towards the bottom of the home page and also direct users to content that is not on the home page.

Belt questions centered around how users navigate and interact with them. Feilding Cage from Time.com discussed some of the questions his organization ponders.

Graphic
Time.com has a belt on every page.

“We are curious about the functionality of our belt,” said Cage. “Are users reading items on the second scroll and beyond? It may be more of a usability issue, but could be an eyetracking one as well.”

Cage went on to explain that there are 10 items on the belt, and there is a belt on every page. He said the top five items (the ones seen without clicking on the arrows in the upper right or left) are huge drivers to the stories they promote. There is a question of how to drive users to the other five featured stories.

“Should we use a ‘next’ button or is it fine that the belt moves from the first five items to the next five on one click?” he asked. “People most often click on the photos to get into the story.”

When is it TMI?

What is the ideal amount of information to present, and how should it be labeled so viewers notice it? How many supplemental links are useful, and when do they become too much?

“I was always struck with the plethora of information entry points on NYTimes.com,” said Nora Paul. “Can we test for impact on behavior? What about cognitive overload?”

The multimedia producers agreed that the issues of how much information to include – and how to successfully present it – are crucial.


Josh Hatch, USAToday.com, addresses labeling links and page density

“We want to know what images people are looking at on our home page,” said Josha Hatch of USAToday.com. “How much chatter do people read? What else are people looking at?”

Hatch also noted concern about whether users notice items such as interstitial ads, sharing buttons, polls and Flash interactives. He and others were curious about whether handcrafted story content (that looks similar to print design) is effective in capturing users’ attention.

Video viewing

Online video has become an expected media form for all news sites – not just those with broadcast stations as their parent.

YouTube.com also has influenced how users interact with video online. (Notice where the video with this piece resides?)

The questions about video presentation were numerous, but the group narrowed it down to three.

What is the best way to let a user know that video is available? Should video be labeled with an icon of a camera, with words, with a player that already is on the page or with a combination of these elements. A local news site in Raleigh recently won a regional Emmy award for its player that is a combination.

Graphic
WRAL.com recently won a regional Emmy Award for its video player that combines methods of interactivity.

What is the best way to present the video once a user clicks on it? Members of the consortium want to know if video should be embedded on the page and play in a specified spot, or should it emerge in a pop-up window at a larger size?

“On CNN, if I see a video icon, I don’t click on it because I don’t want to go to the video player,” said Hatch.

He added that if video is placed in a Flash player, many are not aware it is an option.

Cage added that Time.com is experimenting with different player interfaces, some similar to YouTube.com.

“Has YouTube trained people?” Hatch asked.

What is the best way to handle advertising with video? Advertising combined with online video is creating revenue for news sites. Consortium members decided to look at this issue by proposing experiments that assess the effects of the frequency and positioning of the ads. They also would like to discover if pre-video ads make users leave a site.

How to show your slides

Similar to video, audio slide shows are another basic – and expected – mainstay for news sites. Many questions arose.

“To what degree are users reading captions or script to audio?” Hatch asked. “Also, if ads are swapping out beside the slide show, how does that affect the user experience?’

“What is a good size photo to put on a galleries page?” said Amish Desai from yahoonews.com.


Gabriel Dance, NYTimes.com, discusses slide show usability issues

Consortium members agreed that the questions above should be studied. In addition, they listed these other important areas to research:

  • Should users be provided with the length of time for an auto play slide show, or does this information make them choose not to invest the time in the presentation at all?
  • What is the best way to present a slide show with multiple chapters?
  • Where is the best place to put cutlines?
  • What are the differences in user behavior when ads are placed next to slide shows vs. above slide shows?

    This meeting was a true collaboration among an energetic group of multimedia thinkers. Partner news organizations sent the following individuals to participate:

  • Dallas Morning News: Noel Gross
  • The Des Moines Register (Gannett): Chris Snider
  • Las Vegas Sun: Tyson Evans
  • The New York Times: Torben Brooks, Gabriel Dance
  • San Jose Mercury News: Randall Keith
  • Star-Tribune: Jamie Hutt, Jason Erdahl, Matt Thompson, Will Tacy
  • Time: Feilding Cage
  • USA Today: Joshua Hatch
  • The Washington Post: Nelson Hsu
  • Yahoo! News: Amish Desai

    Watch this column for updates as DiSEL embarks on answering the questions this group introduced. Columns on the DiSEL research projects completed last year will also be appearing soon.

  • OJR's 'five guide' to do-it-yourself website usability testing

    You’ve put months of work into a special multimedia project. The time-consuming processes of creating and editing text, audio, photos, video and animated graphics has been arduous, but rewarding. You’ve learned more about Flash programming and debugging than you ever intended. And now that there’s an end in sight, you are more than ready to get the package online and out of your life.

    Enter the spoiler — the person who utters the words “usability test.”

    “Why bother?” you think. The site works, you know that. You’ve been showing it to your newsroom colleagues along the way. You’ve listened to their feedback. You’ve made changes you thought were necessary. What more could you learn?

    What more? How about 80 percent of the problems with the package? How about architecture flaws you never considered? How about the differences between a good design and a great one?

    As the article Technology’s Untanglers from July 8 New York Times reports, “Sometimes there is a huge disconnect between the people who make a product and the people who use it.” Usability testing is vital to uncovering the areas where these disconnects happen. Its value and power shouldn’t be underestimated in the e-commerce world or in the multimedia journalism storytelling world.

    But it has to be done right with a methodology that works and takes into account a journalist’s tight deadlines. That’s what this column is about. Today we’ll provide you with a template that makes usability testing less daunting. All you need to do is:

    • recruit FIVE people
    • set aside FIVE hours (that’s total time, start to finish)
    • follow the FIVE steps described below.

    FIVE PEOPLE

    It is important to realize that when done correctly, usability testing with five people can uncover 80 percent of your problems, as demonstrated in the chart below by usability guru Jakob Nielsen.


    Jakob Nielsen’s chart from his March 19, 2000 Alertbox Column. http://www.useit.com/alertbox/20000319.html

    Moreover, usability testing is the difference between good design and great design. As we’ve said in the print world for years, if the presentation is aesthetically pleasing, but the user can’t find the information, then the design is useless. This concept is even more important in the world of Web design where clicking to a new site is even easier than finding a new magazine or newspaper.

    What exactly will this accomplish?

    That’s up to you. A properly executed usability test of your multimedia package or Web site can reveal answers to whatever you design the test to ask. However, in most cases it will uncover three key things:

    • Areas of confusing navigation. There is no doubt that as the project designer, you know how your site navigation functions. You know the “Part Two” menu option brings the user to a particular story or audio slide show. But does the new user know this? It is important to realize that about an hour into designing your project, you may have lost all perspective on how the interface appears to others. This also holds true for your colleagues who have been looking at the project as you have been creating it. You all have learned your navigation; you have conditioned yourselves to go where you want. But for others it may not be so easy and intuitive. You need to test and see.
    • Users’ intuitive viewing sequences. Again, this is an area that designers tend to have in mind and follow as they work on or show the site to others in the newsroom. A usability test can reveal if others will follow what you intend.
    • Roadblocks in the flow or delivery of information. Not everyone in your target audience may know that the e-mail for the reporter is at the end of the text or that the panoramic photograph moves when the arrows on either side are clicked. What seems normal and natural to the creator is not always so with the user.

    FIVE HOURS

    What! Who has that kind of time? Although it may seem daunting, think about the hours you’ve already put into the project. If simple changes you make can help the user actually understand the project better or more completely, isn’t it worth it?

    The testing method outlined below is a combination of suggestions from technology experts, journalists and usability professionals and is created especially for the busy multimedia journalist. It not only focuses on issues specific to the types of site or package designs we do, but it also takes into account newsroom deadlines. So from start to finish it should take one person about five hours to get solid usability data about your package. Here’s the breakdown:

    • 30 minutes to meet with project team and determine key questions
    • 30 minutes to add your specifics to the basic pre-and post-surveys provided
    • 30 minutes to recruit test subjects
    • Approximately two and half hours to test five people for 20 minutes to a half hour each.
    • 30 minutes to analyze data
    • 30 minutes to summarize the results and create a task list.

    This testing is leaner and more streamlined than an expensive one designed by a usability firm, but it has been put to the test by my design students on award-winning multimedia news packages as well as journalistic Web sites for the past three years and has delivered valuable data each and every time.

    Before you start….

    • Check your ego at the door and separate yourself from your creation. If you don’t think you can do this, have someone else on your team handle the testing. No doubt you have an emotional attachment to this project that has consumed you for the past months. That’s only natural. But objectivity is necessary to get test results that will make your project even better. Be sure you want the real answers.
    • Realize the limitations of the information you are gathering. Usability tests can reveal valuable information about a particular project, but the results should not be misconstrued as pertinent to all Web presentations. Here is where that number five (in terms of test subjects) is too small and your test design is too specific. The test results are helpful for the project you are testing. When you do another project, you’ll need to do another test.
    • Know it is OK to ask for feedback. As journalists we have been trained to NOT go back to sources and show them stories beforehand. Remember that this is different. We are asking an uninvolved group (not the story sources) to do what they normally would do with a Web package. Then we are taking that information and improving the site. It essentially is another step in the information gather process.

    FIVE STEPS

    What follows are the basic steps and considerations for creating and executing a test on your multimedia news package.

    Step 1: Determine tasks to test Call a meeting of the project team and:

    • Review. Remind everyone of your target audience and site goals.
    • Choose tasks. Determine at least ten (but no more than 15) tasks that you a user should be able to successfully execute to get the most out of the package. Remember, you cannot analyze the entire presentation. Carefully select tasks based on what actual users of the site would do. These could include items such as finding and playing an interactive game you created, watching the audio slide show through completion or navigating the site in a specific, preferred order. Here’s a good list of questions to help.

    Step 2: Experimental design 
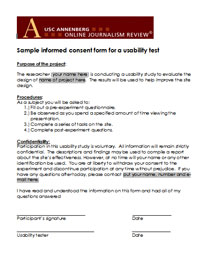
Although there are multiple ways to design a usability test, we are providing you with a basic design that has been proven to work on multimedia news packages. As you become more experienced in testing you may want to deviate from this outline, but we strongly suggest you follow it exactly your first few times.

    • Welcome, complete informed consent and pre-experiment questions. It is important you do your best to put users at ease by thanking them, offering them a cup of coffee, or just chatting with them for a few minutes. Remind them that it is the multimedia package that is being tested, not them. You then will want users to read and sign an informed consent — where the experiment is explained for the test subjects. This is necessary to ethically complete this inquiry. Finally, you will want to have them complete the pre-experiment questions that you will develop in Step 3. Time: 5 minutes
    • Free observation time. This is a time when users explore the site with NO interaction from the tester. You simply direct the user to the site and step back. The only instruction should be for users to “Explore the site for as long as they would like.” Here is where you can either videotape their behavior or take copious notes. You want to know what users do when just directed to “explore.” Allot 10 minutes total, but if the user tells you he or she is done beforehand, move along. If they are not done at the 10 minute mark, make note of that and tell users it is time to move on.Time: -5-10 minutes
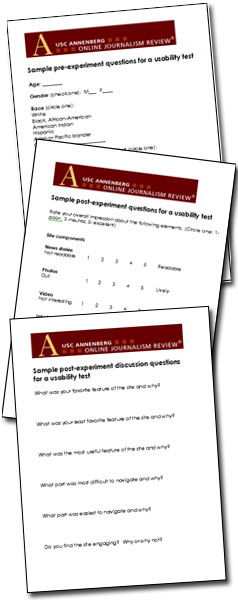
    • Assigned tasks. Using the list you created in the step above, ask users to execute your preferred tasks. Word the tasks so that you are placing users in a natural scenario. For example, rather than stating, “Find the e-mail for the reporter,” say something like, “You have an unanswered questions after viewing this presentation and would like to contact the reporter. How would you go about doing that?” Have tasks ordered and prioritized, skipping over any that were completed during the free observation time. Depending on the user and the task you may or may not want the user to “think aloud” or describe their thought processes to you while completing the tasks. At this point in your testing, either silent observation or think aloud protocols are fine approaches. Do whatever feels most comfortable to you. Time: -5-10 minutes
    • Post experiment questionnaire and discussion. There are two parts to this stage in the process. First, have users fill out the questionnaire you will develop in Step 3. Once complete, it is time for open-ended questions that are answered in a conversation with you.

    Step 3: Develop questions There are four printed forms you will want to have ready for each test participant:

    • Informed consent. Necessary for ethical completion of the study. Sample here.
    • Pre-experiment questions. The purpose here is to give some context to the results and help you understand the Web practices of your test subjects. As the sample form suggests, you want to have users quantify their responses and word questions so that the subjects’ personal interpretation of the answers is minimal. For example, instead of asking a user to describe their Web usage on a scale of 1-10, with one being none and 10 being heavy, it would be better to ask them to quantify the amount of time they spend online and provide choices such as 0-2 hours/day, 3-5 hours/day, etc. You also may want to ask questions that gauge the participants’ interest in the subject of the presentation you are testing, or the Web site your work for. Make this a written questionnaire. A sample can be found here.
    • Post-experiment questions. You will want to administer a written questionnaire once the tasks are completed. This questionnaire should gather subjective data, and should contain quantifiable inquiries, asking users to rank the success of certain aspects of the site. A sample can be found here.
    • Interview questions. Finally, plan a few open-format interview questions to ask each participant at the end of the session. These should elicit more overall, qualitative impressions of the website. You also may want to ask participants what they recall about how the site functions. If they clearly recall the structure, you can bask in the glory of your success. If not, you may want to consider where clearer labeling or directions may help. Users should not write these responses. You should allow them to speak freely and take notes. A sample can be found here.

    Step 4: Gather data The order of data gathering is outlined in Step 2 above. Here are items to consider before you begin with the first test subject.

    • Test sooner rather than later. No multimedia designer wants to make changes to something they believe is in its final form. Schedule your usability test in the beta stage of development — not quite finalized, but final enough so someone can navigate the site.
    • Do not test your newsroom colleagues. Anyone already familiar with the project does not represent your typical user. In an ideal world, test subjects are recruited through a marketing research firm, but — for the busy newsroom journalist — this probably isn’t possible. So go to other departments. See if someone in ad sales, circulation or marketing (who doesn’t know about the project) can spare a half hour to be tested. See if a friend or relative of a colleague can come in. Bottom line, try to make your test subjects as close to typical users as possible.
    • Test everyone on the same computer, in the same location. This will standardize the results and not allow people’s bookmarks or other preset browsing options interfere with results.
    • Know what you are looking for during the free observation period. Carefully observe each session and take notes about the participants’ interactions with the site. Which tasks were performed successfully? How long did they take? Did participants make errors? What problems occurred? Did the participants have a conceptual model of the site? Was it correct? It can be helpful to have a checklist for yourself during this time, so you observe the same behaviors with each participant.
    • Pay close attention to the steps users take to complete tasks. You want to discern the path that is clear and most natural for users when completing tasks. Ideally they all will complete tasks in fairly predicable ways. But if they do not, you can learn something by the “mistakes” they make. How do they recover? What page of the site do they go back to as a “home base” or starting point? Again, you may want to have your own checklist to refer to here.
    • Try to be as unobtrusive as possible. We know… you feel like an elephant in the room when observing someone viewing a website. But awareness of your body language and your non-verbal reactions to the users’ behaviors can make a huge difference in terms of their comfort. It will take them some time to get used to your presence, but once they do, they will become more relaxed and their behaviors will be more realistic and natural.

    Step 5: Analyze data and make list of potential improvements

    Now the fun starts — seeing what you have learned. Again, take things step-by-step:

    • Average all quantifiable responses. Break down the number of men vs. women, the average age of participants, etc. Be sure the demographics match your target audience. You also will want to average the answers to all questions that involve rankings. Place all this data on one sheet and make notes of responses that fall to either extreme.
    • Look at the free observation notes in light of the quantifiable data. If users ranked navigational controls as weak, what behaviors during the free observation period support this? Can you find similar behaviors that would contribute to this ranking? Were there any non verbal cues that indicated their frustration at during a certain process? Sighing? Trying to click off the site? Gather as much supporting data for each ranking
    • Look at the success/failure to complete usability tasks in light of the quantifiable data. Again, go back and see what common behaviors were exhibited by the users when asked to complete certain tasks. Did they become confused at the same points? Did they all sail through certain tasks? You will discover that their site rankings will correlate with their experiences completing tasks.
    • Make a list of at the top three things that should not change and the top three things that should. You are on a deadline, we realize that. So be sure to make note of what is working and why. Write down the top three things you did well based on this usability test. Then make a list of three manageable changes to make.
    • Look at user suggestions for improvement in light of the changes you need to make. Your users aren’t designers or interface experts, but their gut reactions can help you determine where to put your professional energies. See what they said they want and find a design solution for it. Again, keep things manageable. You aren’t going to fix everything, but you are going to tackle the top three you listed in the step above. Do everything you can to address the problem areas, and — if possible — check in with the users and show them the solution.

    BOTTOM LINE

    Usability testing is a skill that — just like design and programming — you improve the more you practice it. Once you’ve done this a few times you’ll find you can use it on the fly when you get into those disagreements about interface design issues within your department. At UNC, we resolved a design issue on a project in Chile this past March. We were working with students from Universidad de los Andes and could not come to a consensus on our secondary navigation. So, we did a quick usability test with audio reporters and photographers who were in the newsroom, but who had not been involved in the design process. What we found was that the design team was split over two equally ineffective navigation methods. It forced the team to rethink at a more basic level and resulted in a much improved solution.

    So remember, that person who suggests usability testing isn’t the spoiler, but really your friend — and the friend of your audience.

    ADDITIONAL RESOURCES

    Don’t Make Me Think
    This is an excellent book by Steve Krug. It should be on the desk of every multimedia news designer.

    Step by Step Usability Guide
    Part of the site usabilty.gov, this diagram is a good visualization of the testing process.

    Usability Testing Guidelines
    This piece provides a simple tutorial for a general usability test and includes some insightful tips.

    Animated infographics and online storytelling: Words from the wise

    Sometimes the best research is the voice of experience. Alberto Cairo, former director of infographics and multimedia at elmundo.es in Madrid, is known worldwide for the work he has done using animated graphics as a powerful storytelling tool. While at elmundo.es, his staff won more NetMedia, Malofiej, and Society for News Design awards than any other publication in the world. In the 2004 edition of the SND.ies, the Society for News Design’s Best of New Media Design competition, Cairo’s department won the first gold medal ever given for breaking-news coverage.

    Now an assistant professor at the University of North Carolina-Chapel Hill (and a colleague of co-columnist Laura Ruel), Cairo has been taken his hands-on knowledge and moved it into the classroom. Here is a link to some of his students’ work: http://www.albertocairo.com/jomc/projects/index_projects.html.

    Graphic
    International animated infographics expert Alberto Cairo is writing his first book, Visual Journalism: Print and Multimedia Infographics Storytelling.

    Many online journalists are anticipating the book’s release, which should be in 2008, because there is an urgent need for the guidelines it provides. So, below we have offered you a form of a “sneak peek” – Cairo’s advice for multimedia storytelling using informational graphics.

    Q: Define animated infographics and describe why they are a powerful storytelling tool for journalists?

    A: Traditional infographics consist of the use of the tools of graphic design, illustration, cartography and statistical representation to convey journalistic information. Web infographics increase the number of tools to include the ones of online storytelling: 3D and 2D animation, interactivity, audio and video.

    Infographics are difficult to define precisely because of their multiple and flexible nature. Almost any informative representation where verbal and visual elements are combined, and that is intended to tell a news story, can be considered an infographic.

    Infographics have been crucial throughout the history of journalism to explain things that could not have been told otherwise. It is obvious that there is not better way to display large sets of data than with a good statistical chart, or to provide geographical context to a story than with a map. In my book I explain that, on an abstract level, an information graphic is an aid to thinking and understanding. This is not a new idea, of course. A good infographic makes patterns arise, discovers trends, condenses enormous amounts of information in a very small space.

    To understand why infographics are so important to modern journalism, try to think about stories such as September 11th, the invasion of Iraq or the shootings at Virginia Tech without them.

    Q: What are three current examples of excellent animated infographics? Why are they effective?

    A: The New York Times has the best statistical online infographics in the news industry at the moment. They have finally understood that in the Internet era infographics cannot be just static, linear representations. Sometimes you have to let the reader transform the information and play with it. You have to let the readers adapt the data to their needs.

    Graphic
    Cairo believes that the work of nytimes.com is some of the best online inforgraphic storytelling. The graphic above is one where users can interact and “play” with the numbers themselves.

    Among the best recent multimedia coverage, I would highlight the Times’ interactive about the Virginia Tech shootings. The combination of audio, video and information
    graphics makes this breaking news coverage one of the best I’ve ever seen. You see, almost any publication can create a good long-term, feature project online. It is much, much more difficult to do that in a tight deadline.

    Graphic
    The Times’ ability to create quality animated storytelling on deadline is noteworthy, according to Cairo.

    With their most recent hires, The New York Times is trying to emulate the model we used at elmundo.es back in 2000-2005. The are focusing more on breaking stories, rather than on features. Don’t get me wrong, features are great, but a newspaper should focus first on up-to-date information.

    The best animated diagrams can still be found in Spanish news organizations. Elpais.es and Elmundo.es keep publishing great linear explanations. Athough their work is still a great source of inspiration for professionals worldwide, both news organizations need
    to think about new ways of presenting information. They cannot continue to succeed if you by using the same formula over and over again. In the current environment, your work gets dated quickly if you do so.

    Graphic
    Spanish news organizations, such as elmundo.es, still are producing the best animated diagrams and linear explanations.

    There are news organizations in the United States that currently are taking steps in the right direction. I would mention The Dallas Morning News, San Jose Mercury News, and The Boston Globe. The Sun-Sentinel is still a major reference for multimedia graphics as well.

    Q: What are the most common mistakes multimedia journalists make when creating animated infographics? How can they avoid them?

    A: The first and gravest mistake that individuals make believing that infographics are a branch of graphic design or that they have anything to do with illustration.

    Infographics, like any other form of journalism storytelling rely on solid, accurate content. It is great if you can create cool 3-D animations and great interactive scenes, but if your content is weak, the presentation will be weak. There are not good infographics without good reporting.

    As a second mistake is the fact that many people think that online infographics can be created just by “translating” print pieces to the Web. Unfortunately, this is what is happening in many newsrooms worldwide. That’s the wrong approach because what you usually end with is with a still picture with a bunch of roll-over buttons. In order to create a great multimedia infographics piece, you have to think about it from the very beginning, on the planning process, rather than consider it a subsidiary element that depends on the content generated by the print side. Print and online use different languages that share the same root grammar. They are dialects.

    Q: Can you provide us with a checklist of questions for editors to ask themselves when deciding if an animated infographic is the best storytelling method for a given topic?

    A: Checklist:

  • Can the story be explained using a map, a statistical chart or a diagram? If you need to show the “where” of the story, you definitely need a map.
  • Are there size, length, distance, amount comparisons involved? Then, you need a chart.
  • Is there any process or procedure hat can be better understood by means of a visual display? Create a diagram.
  • Do you need to recreate the scene where the story took place? In this case: do you have enough information to recreate it accurately, without making up details? This is crucial. The old infographics motto says: if you don’t know how it is, don’t draw it. I’ve added my own corollary to that motto: if you don’t know how it moves, don’t animate it.
  • [More suggestions from Cairo at: http://www.albertocairo.com/infografia/articulos/2006/design.html
    http://www.albertocairo.com/imagenes/articlesndsummer.pdf]

    Q: What suggestions do you have for individuals in an online newsroom who want to begin creating animated infographics?

    A: It’s quite simple: give it a try. You don’t need to be a Flash guru to create online infographics. Learning just the basics (something that can be done in two or three days of training) can give you the main tools needed to start working. Then, with experience, you will incorporate new tools and techniques. That’s the path we followed at elmundo.es back in 2000. Nobody in my team had any experience.

    The conceptual side is also extremely important: you need to educate yourself. Read about the psychology of vision. Understanding the basics of cognitive science is crucial. Study cartography, statistics and information design. There are many great books out there.

    Q: What are some things the industry can do now to challenge itself to move in the right direction with multimedia infographics?

    A: Understand that to obtain profits, you have to invest in training, equipment, innovation and good staff. Cutting expenses might be good in the short term, but it will hurt quality in the long term. The quantitative evidence suggests that publications that increase quality and focus more on stories the readers care about (not necessarily local stories) don’t lose readership – or they lose it in such a slow, steady pace that it will give them time to become completely online. Innovation is crucial in this equation: create new ways to convey information.

    If you want to survive in the current environment, you have to attract online readers by offering them content presented in ways they will not be able to find anywhere else. Any citizen journalist can present information using words or pictures. It is much more difficult to find good user-generated multimedia or infographics content. Engage your readers by offering them breaking-news, accurate and spectacular infographics presentations. My experience in events such as the March 11th 2004 terrorist attacks in Madrid tells me that readers really appreciate the efforts.

    Graphic
    Elmundo.es’ March 11 graphic got millions of page views in just a few days.

    Other breaking-news presentations at elmundo.es did not generate so many visits, but they were extremely successful in other ways. In some cases, they were local breaking-news stories. Again, any newspaper can do an infographic on the latest NASA mission, but only a few can do a sophisticated online presentation on the state-of-the art steel bridge that is being built right next door. You have to find the right balance between global and local. Never forget one of them because you’re focusing too much on the other.

    Q: Who has influenced you most as a professional?

    A: The people I’ve worked with: the folks at La Voz de Galicia, Spain, who accepted me as an intern. My partners at Diario16, DPI Comunicacion and elmundo.es, of course.

    After that, almost anything I read or see influences me. I am like a sponge. My own students have a huge influence on the way I think about infographics, too, especially those that participate in our multimedia documentary projects. When they participate in those projects they are usually a few months away from graduation and cannot be considered mere undergraduates anymore. They are professionals ready to get an entry-level job as infographics journalists – and to surprise you with their creativity.